Expenses tracking
How expenses tracking works
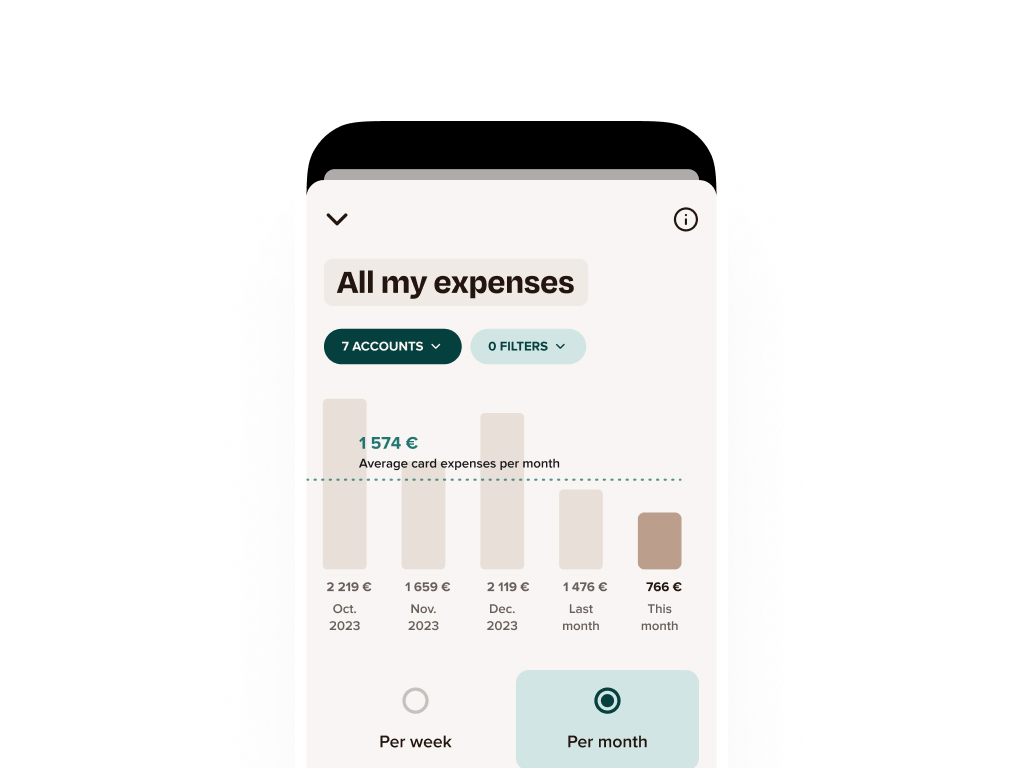
Expenses tracking is available in the in-app "Payments" tab for all Sumeria+ customers. Customers can tap any given chart to see the details.
- By moving the chart horizontally, they can see the previous weeks and months
- They can also see the details of the expenses by tapping the columns. All card payments (physical, virtual, contactless) are represented in the graph. Wire transfers, however, are not included.
- The dotted line represents the average amount spent by card in the 5 time periods that are displayed and over.
Customizing the analysis
By default, the main view displays the expenses per month on all accounts. To customize this, customers can edit the following:
- Accounts: selecting the accounts they wish to analyse
- Filters: selecting the expense categories they are looking for
- Time period: choosing between a monthly or weekly analysis
- Recurring payments: choosing to take into account or not recurring payments (e.g. Netflix, Spotify).
Access
Customers can add multiple views to their expenses analysis.
To do so, they can simply tap the "+" sign in the "Payments" screen. Customers can then edit the title as well as the display settings of the view.
Recommendations for displaying multiple views
Here are some recommendations to make the best out of multiple expenses tracking views:
- Comparing monthly and weekly expenses:
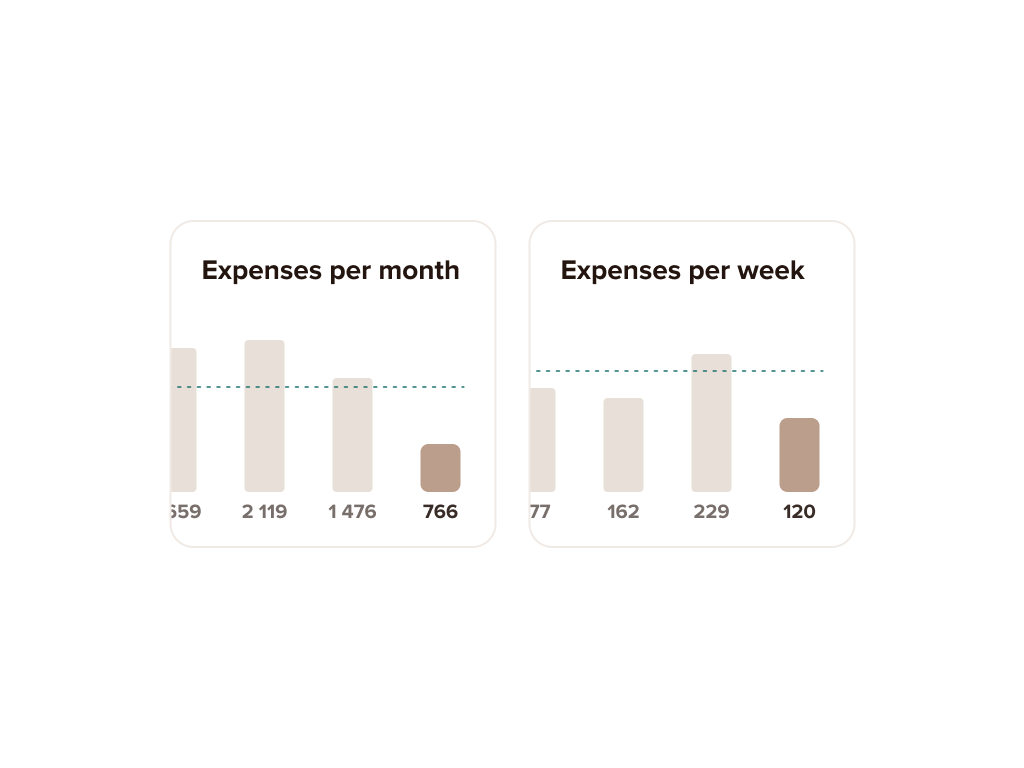
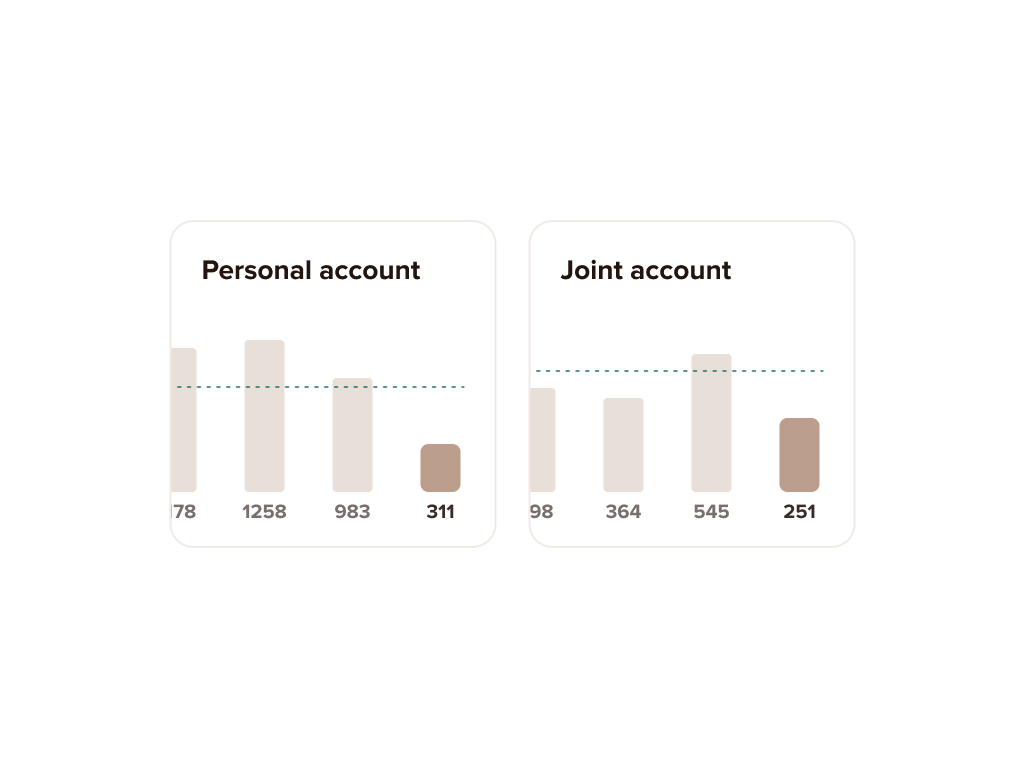
- Comparing a main account and a shared one:
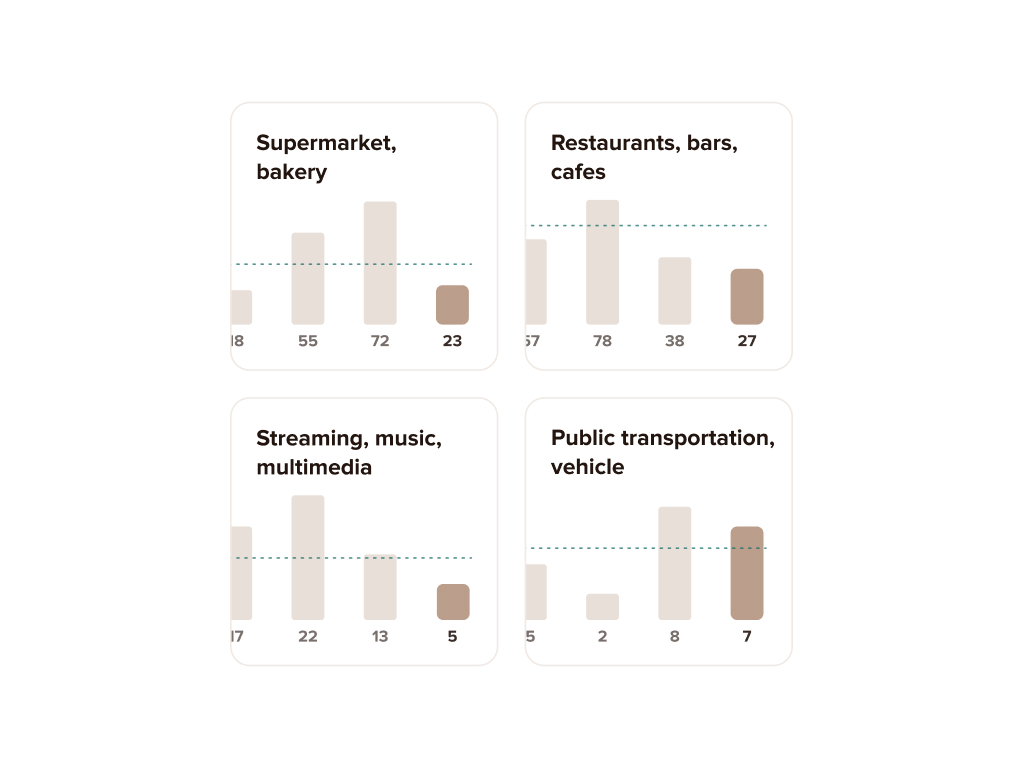
- Comparing category expenses: