Budget accounts
Budget accounts are a category of Sumeria accounts designed to help customers better manage their personal finances. They allow Sumeria+ customers to organize their money by spending category, with one account per category and a predefined maximum amount not to be exceeded. It's the digital equivalent of traditional paper budgeting envelopes.
Création
Once in the account creation process, the customer is prompted to choose a name for their budget account that reflects the type of expenses they want to track, such as "Leisure," "Shopping," or "Groceries."
They must also set a maximum amount not to be exceeded each month.
This process should be repeated to create as many budget accounts as needed, depending on how many spending categories the customer wants to organize.
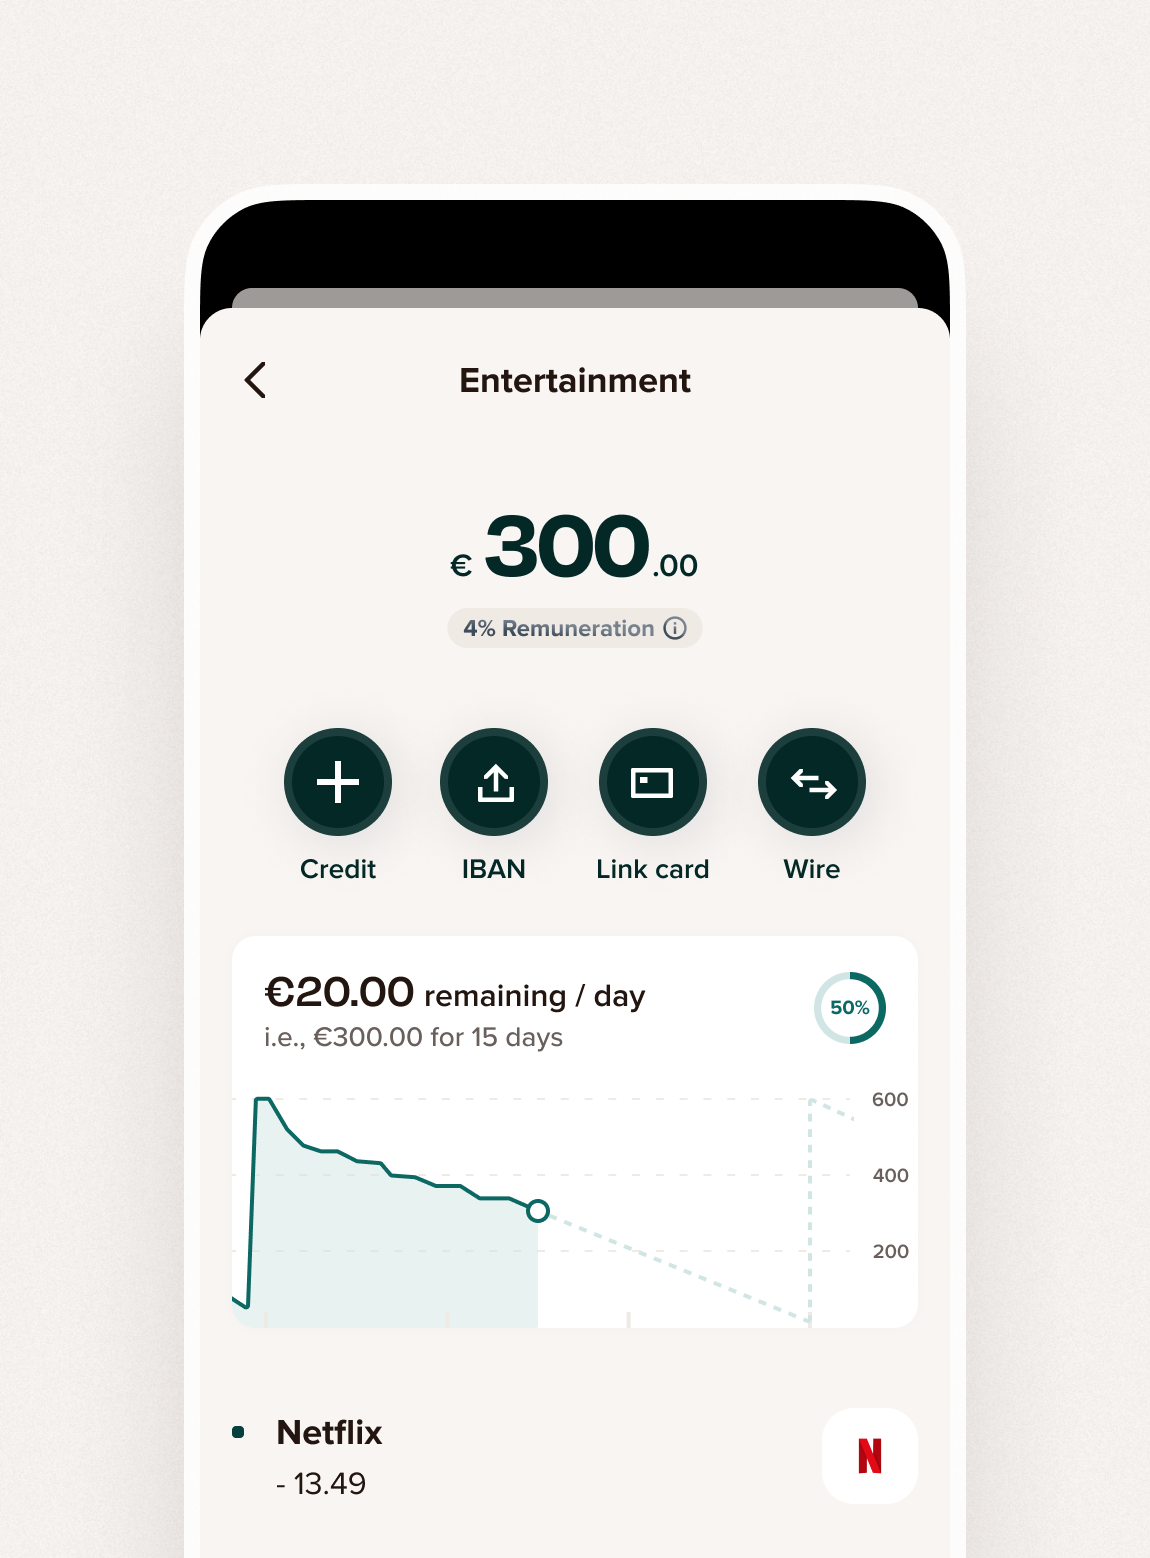
Budget evolution graph
A graph is displayed to help track spending throughout the month.
It shows the remaining budget amount that was allocated for the current month by the customer, for the selected budget account.
Choosing the beginning of the time frame
The chosen date will be used to set the start date of the graph. By choosing the first day of the month, that's when the graph will begin, meaning it will end on the 30th or 31st of the following month.
The chosen date marks the starting date of each time frame. The graph will show a suggested curve of expenses for the chosen time frame based on the budget.
Budget calculation and balance prediction
To organize their budgets, customers can view the following information on the graph:
- Display of current balance and expenses in real time.
- Money that can be spent each day until the end of the time frame.
- A percentage of the total budget that has been spent during the ongoing time frame.
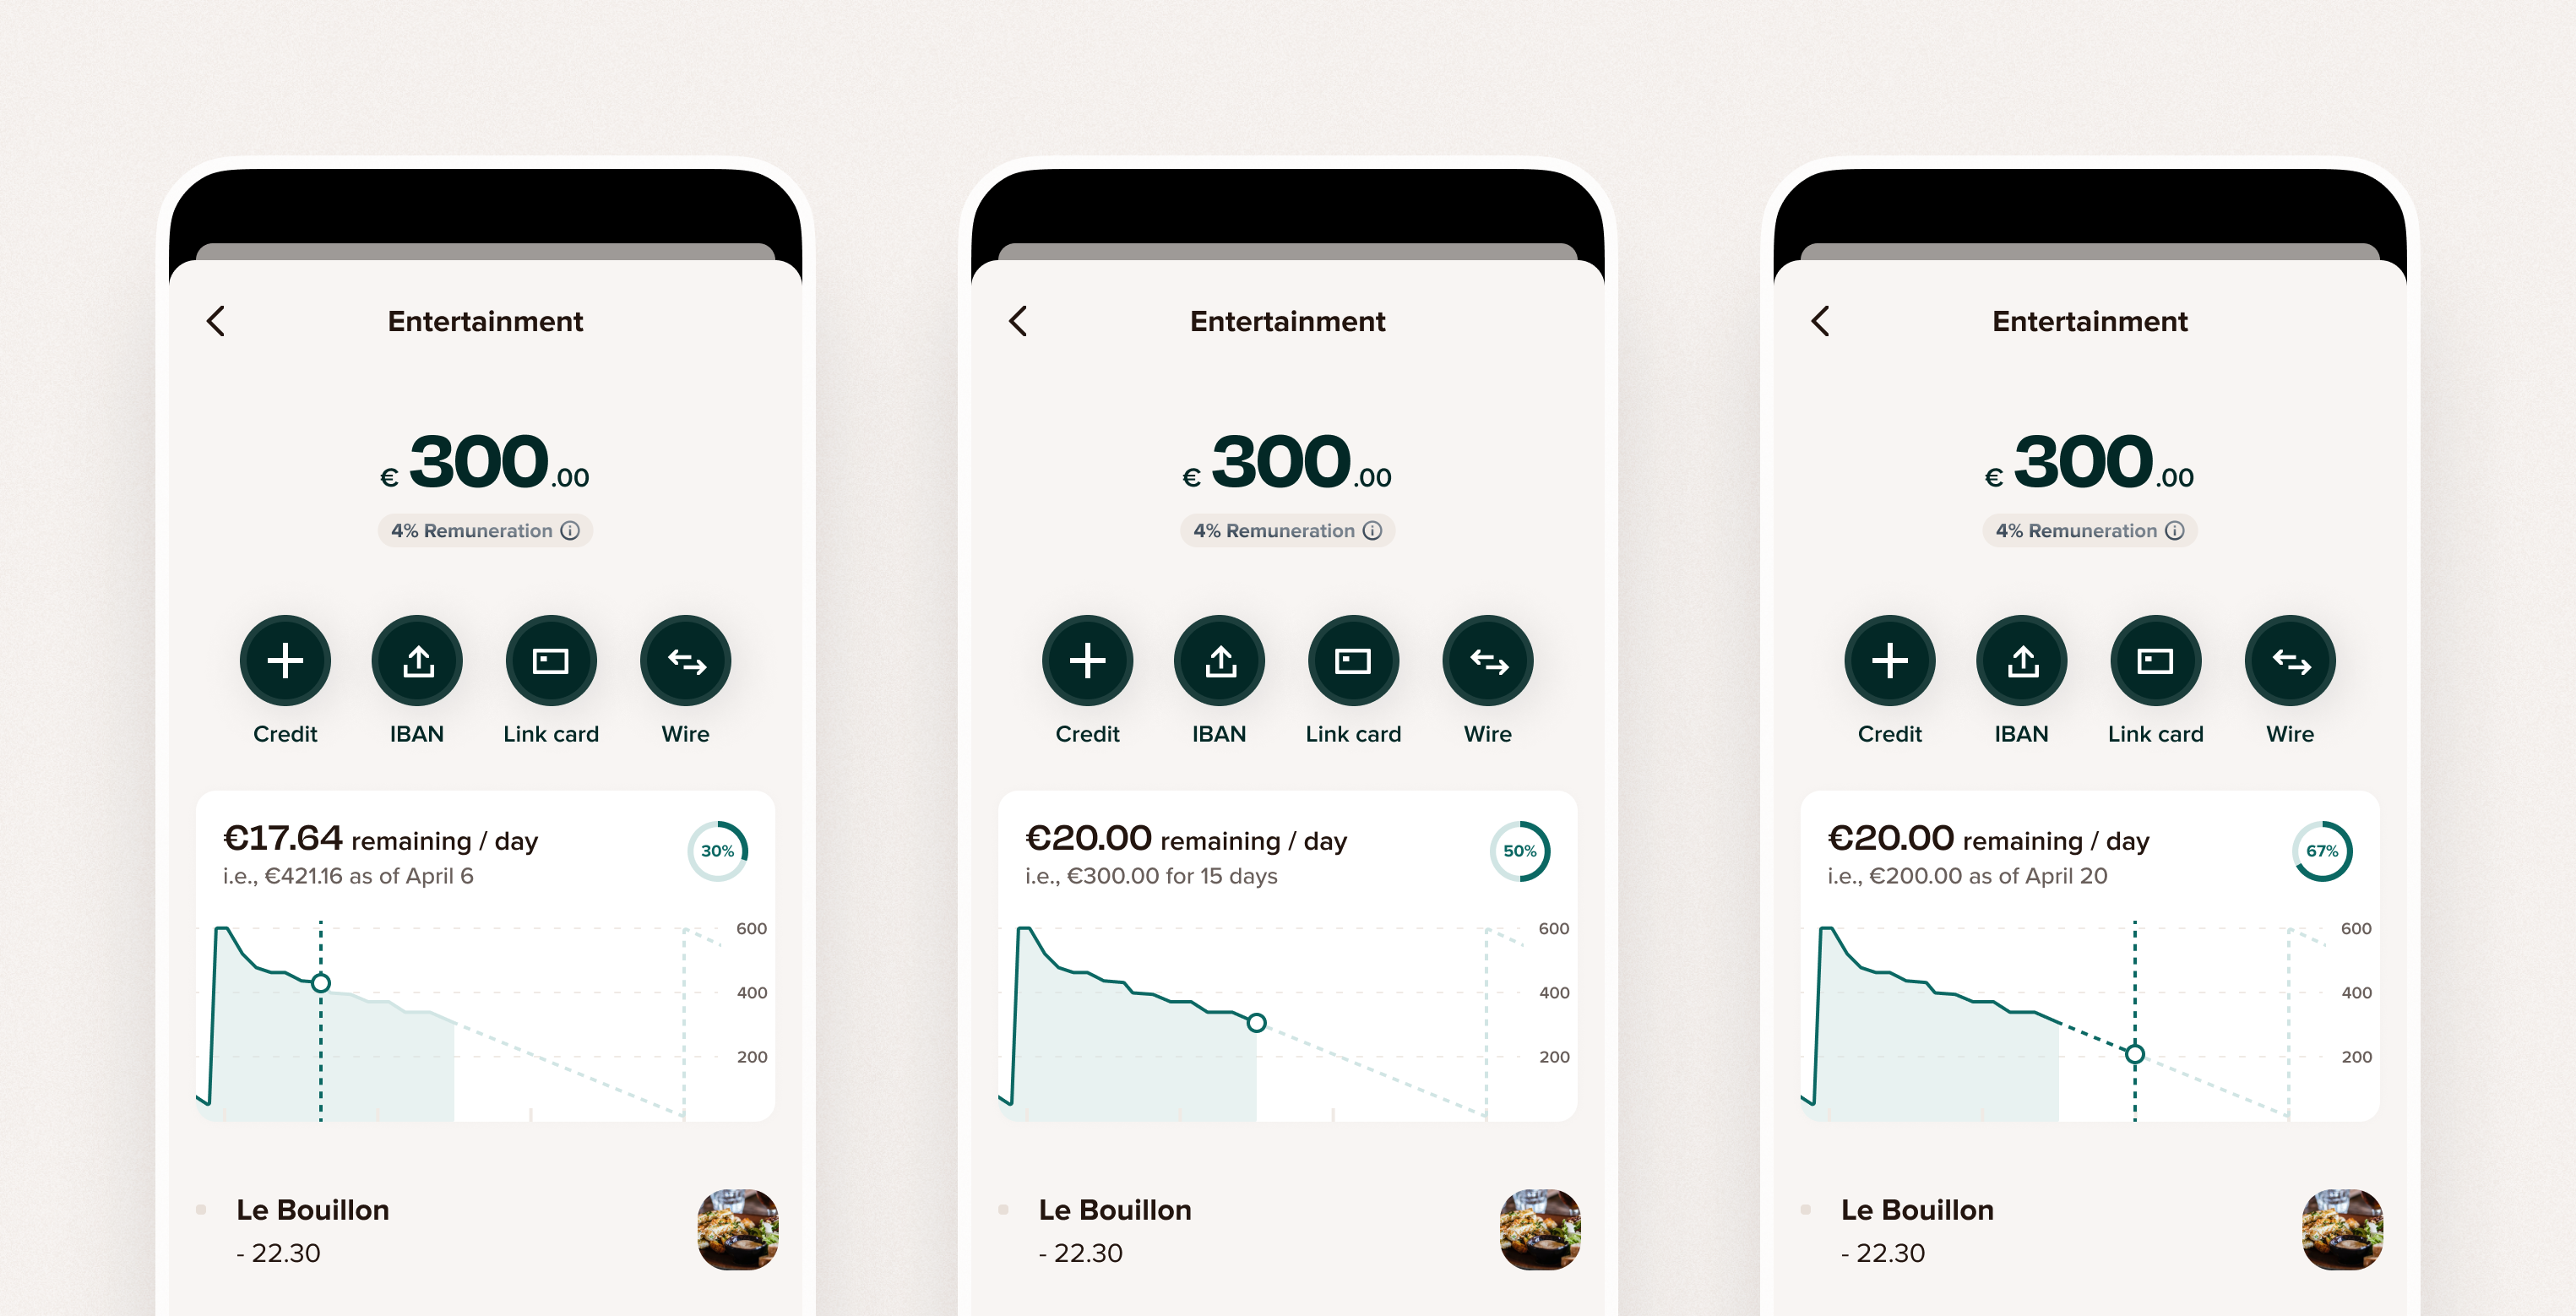
Display of past expenses
When customers choose a past date on the graph, they can see:
- The balance at that date (at midnight).
- The estimate of daily expenses on that day (at midnight).
- How much (in %) of the budget was spent up until that day (at 11:59PM).
Display of future projections
When customers choose a future date on the graph, they can see:
- A linear projection of the account balance until the end of the chosen time frame.
- The estimate of daily expenses on that day.
- An estimate (in %) of the budget that will be spent up until that day.
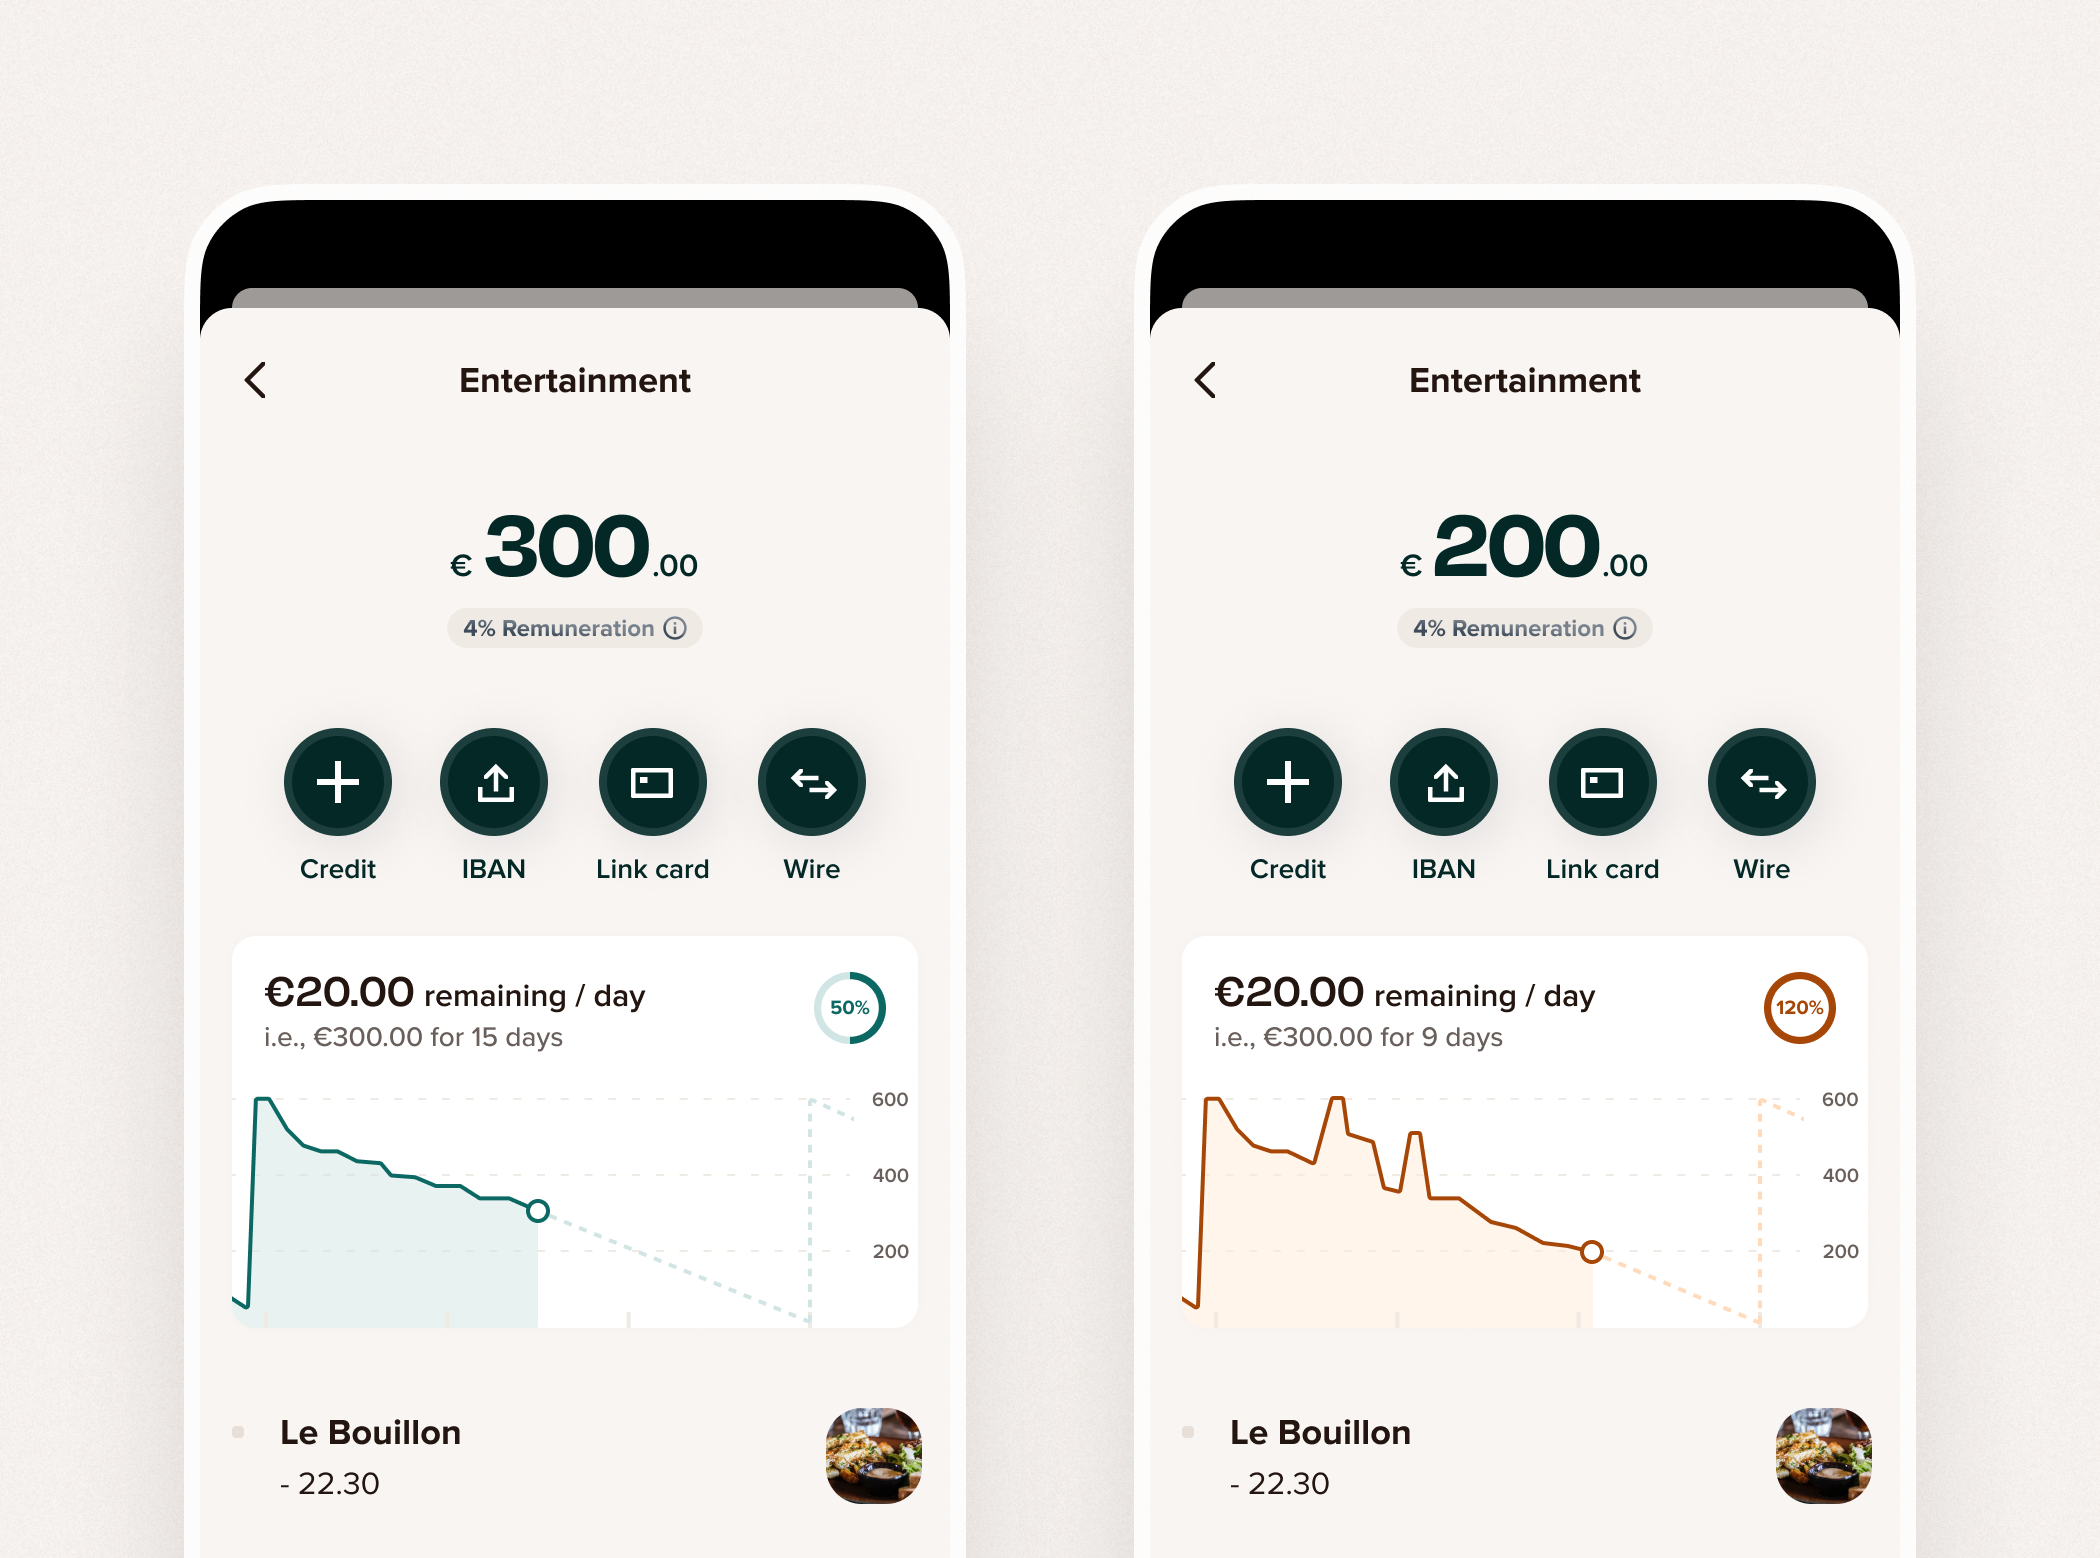
The graph allows customers to view at any time how much money they have left before reaching the limit they had set. If this limit is exceeded, they can also see exactly in percentage points by how much the limit was exceeded. They can then adjust their expenses or reassess their budgets.
Spending with a budgeting account
The customer can choose which account to debit either before or after making a card transaction. Learn more.